Covid-19 Local Humanitarian Action Visualisation | Humanitarian Policy Group
“Working with Tekja on how best to visualise our database as well as complex findings from our research was not only a fascinating experience but also a very successful one. Tekja grasped our intentions and translated them perfectly into a digital visualisation … We believe these data and digital visualisations helped bring more attention to our research and facilitated the dissemination of our findings and recommendations.”
The ‘Covid-19: tracking local humanitarian action and complementary partnerships’ visualisation documents the role of local actors in the context of Covid-19. Using a live survey it collates evidence of how the Covid-19 pandemic has changed the way in which humanitarian actors practice at different levels, and how complementary ways of working are contributing to humanitarian outcomes.
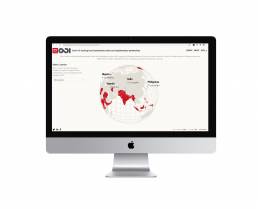
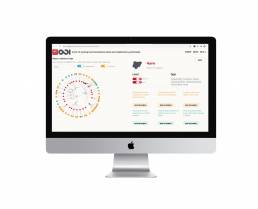
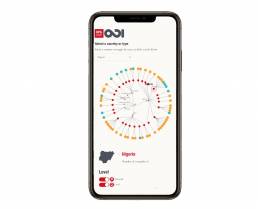
The visualisation focuses on an interactive spinning globe through which users can select a country of interest, the country view allows users to explore the individual stories in more depth.
The tool is also used as a resource to garner further submissions to the global survey that will contribute to painting the picture of how humanitarian aid systems are changing and adapting in light of the global pandemic in 2020.
The interactive is live here.
ClientOverseas Development InstituteOutputInteractive map, micrositeYear2020


