We are an award winning data visualisation studio
Tekja is an award winning data visualisation and analysis studio based in London, founded in 2012 by Jacopo Hirschstein and Amanda Taylor.
The studio sits at the intersection of art and technology, creating data driven installations, event experiences, web applications and media content. With a focus on combining cutting edge data analysis and visualisation techniques with standout contemporary designs and concepts.
Selected Works
What we do
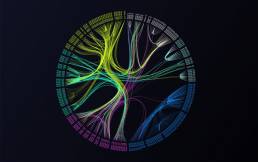
Data Visualisation
We specialise in data visualisation and information design, providing engaging insight into data and complex information. We create interactive applications, infographics, animations and 3-dimensional experiences for exhibits and events.
Data Analysis
We process, clean, mine, crunch and analyse data of any size, from any source. We design bespoke algorithms and use cutting edge technologies in machine learning, natural language processing and spatial analysis.

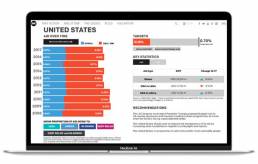
Mapping and Spatial Analysis
We specialise in spatial analysis and mapping of data of any size. We process, analyse and build systems and visualisations using geographical data, to reveal trends and patterns as interactive maps, dashboards and animated experiences.
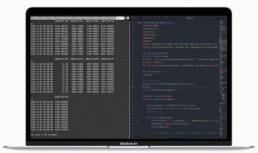
Web Development
We create full websites, microsites and integrate stand alone products into existing websites. We provide full-stack development from backend to frontend, with a particular focus on sustainable data-driven projects (requiring data updates) and real-time systems.
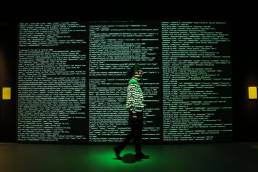
Experience Design
Our digital work often is often developed in conjunction with a 3D physical design to create immersive experiences in museums, at events or corporate environments. We create highly interactive, engaging experiences using 3d physical design combined with a live data experience to engage audiences, increase dwell times and stimulate discussion and debate.

Interaction Design
We consider interaction design the touch of magic that brings data to life. Whether the output of our work is web based or an installation, interaction design plays a key part in our process and enhances the ability of our projects to engage and delight audiences, increasing dwell times and promoting dissemination.
Selected clients


Selected Press

Review: The Economist 1843 Magazine
‘Tekja achieves the impressive feat of immersing viewers in data in the real world.’


Interview: Reuters
Amanda speaks about how data visualisation can help us understand cities.


UN Habitat III Conference
Tekja are winners of a Cityvis Award, presented at the United Nations Habitat III conference.

Feature: Metro
‘The happiest place to live in London has been revealed by our tweets…’