Melting Pot Project
Longlisted for the Kantar Information is Beautiful Awards
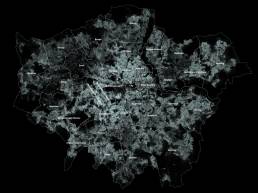
The expression of an individual as a dot on a map is a powerful one when applied to a complex set of data.
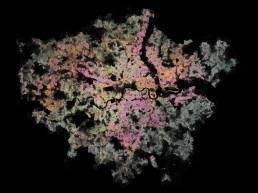
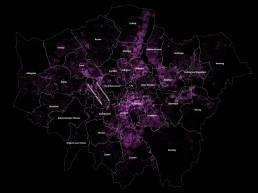
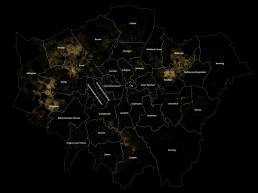
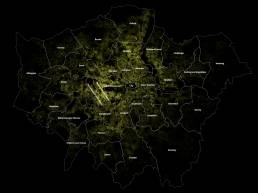
This map shows the culmination of 8,173,941 dots, each dot representing a person living in London and coloured by ethnicity according to the ONS Census 2011.
This map is part of a set of city maps that aims to paint a picture of the vibrant mix of people living, working and moving within the UK’s urban spaces.
ClientSubmission to competitionOutputInteractive map, micrositeYear2014
Share
